二进制部署prometheus+alertmanager+grafana监控平台
下载二进制包:Download | Prometheus
安装prometheus
本文档使用LTS长期支持版:2.45.4
1 | mkdir /usr/local/prometheus # 新建存放prometheus组件目录 |
注册系统服务
1 | vim /etc/systemd/system/prometheus.service |
1 | [Unit] |
启动并设置开机自启
1 | systemctl enable prometheus --now |
检查状态
1 | systemctl status prometheus |
验证
访问http://ip:9090,访问到即可。
安装alertmanager
1 | tar zxvf alertmanager-0.27.0.linux-amd64.tar.gz -C /usr/local/prometheus |
注册系统服务
1 | vim /etc/systemd/system/alertmanager.service |
1 | [Unit] |
修改配置文件
1 | vim /usr/local/prometheus/alertmanager/alertmanager.yml |
1 | route: |
启动并设置开机自启
1 | systemctl enable alertmanager --now |
检查状态
1 | systemctl status alertmanager |
验证
安装node_exporter
1 | tar zxvf node_exporter-1.7.0.linux-amd64.tar.gz -C /usr/local/prometheus |
注册系统服务
1 | vim /etc/systemd/system/node_exporter.service |
1 | [Unit] |
启动并设置开机自启
1 | systemctl enable node_exporter --now |
检查状态
1 | systemctl status node_exporter |
验证
访问http://ip:9100/metrics,监控数据存在即可。

安装grafana
下载地址:Grafana get started | Cloud, Self-managed, Enterprise
1 | tar zxvf node_exporter-1.7.0.linux-amd64.tar.gz -C /usr/local/prometheus |
注册系统服务
1 | vim /etc/systemd/system/grafana-server.service |
1 | [Unit] |
启动并设置开机自启
1 | systemctl enable grafana-server --now |
检查状态
1 | systemctl status grafana-server |
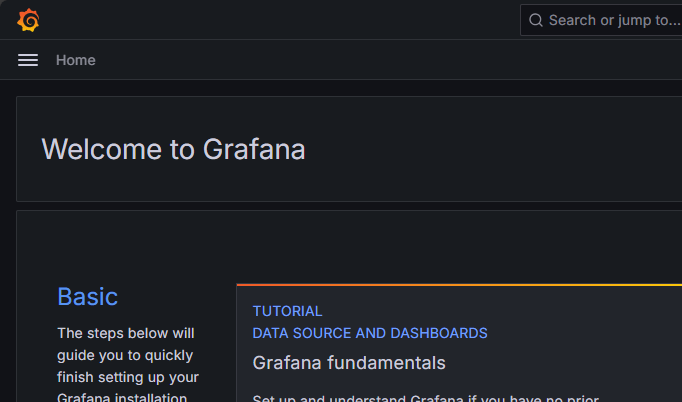
浏览器访问http://ip:3000,账号admin,密码admin,首次根据提示修改密码
添加监控
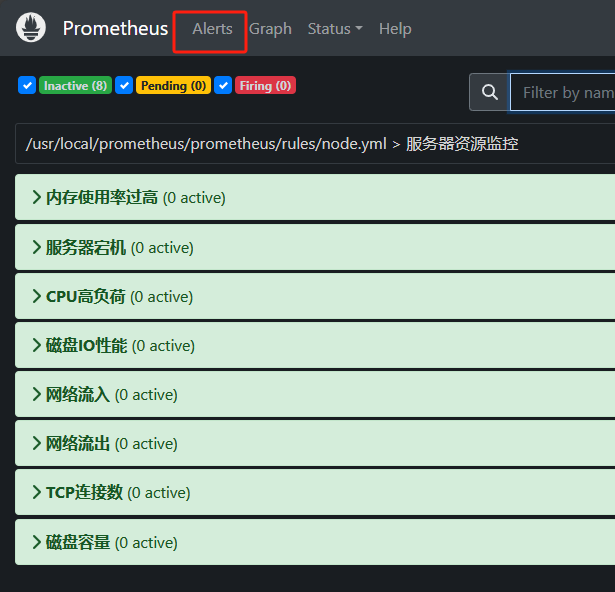
创建告警规则
1 | mkdir -p /usr/local/prometheus/prometheus/rules |
1 | vim node.yaml |
1 | groups: |
修改配置文件
1 | vim /usr/local/prometheus/prometheus/prometheus.yml |
1 | global: |
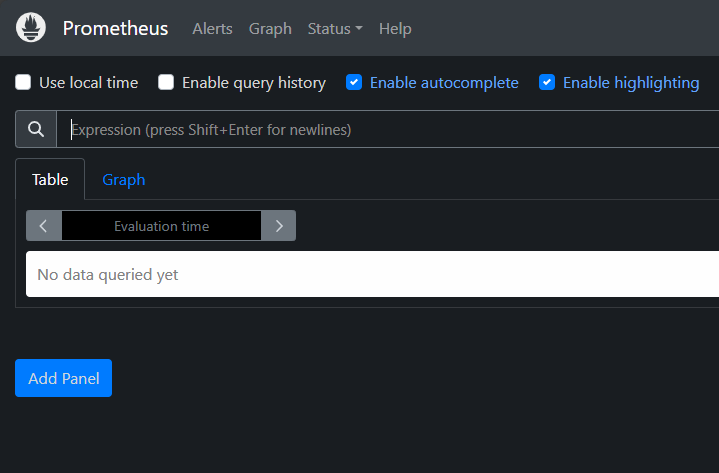
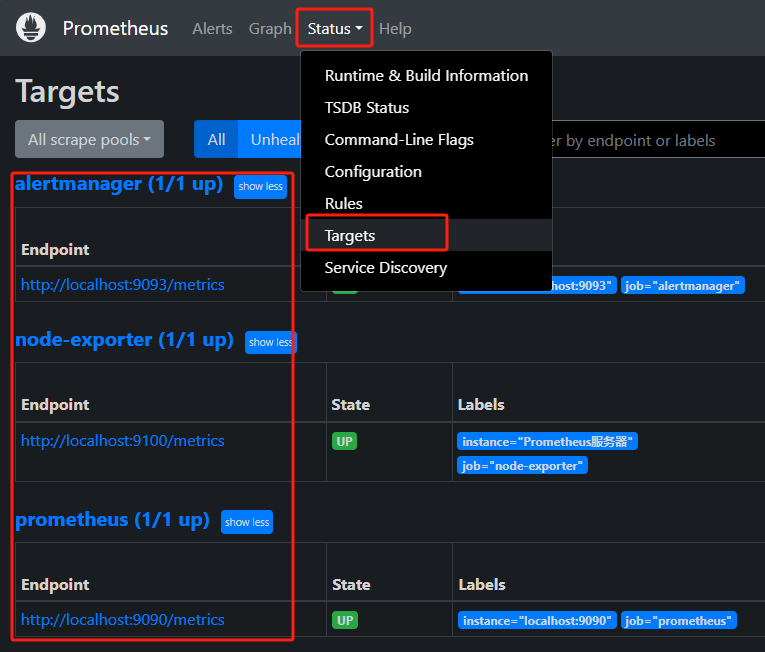
验证数据
重启prometheus
1 | systemctl restart prometheus |
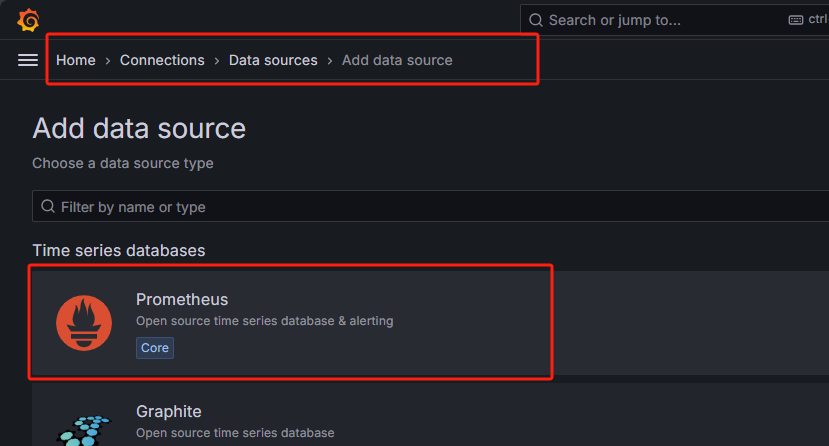
grafana集成prometheus
浏览器添加数据源
添加Prometheus地址,我这里是同一台安装,使用localhost
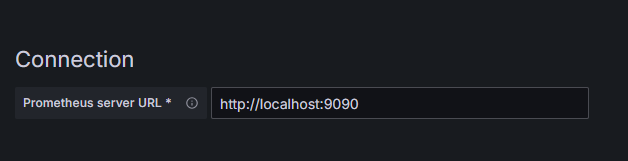
最后保存即可,不需要其他配置。
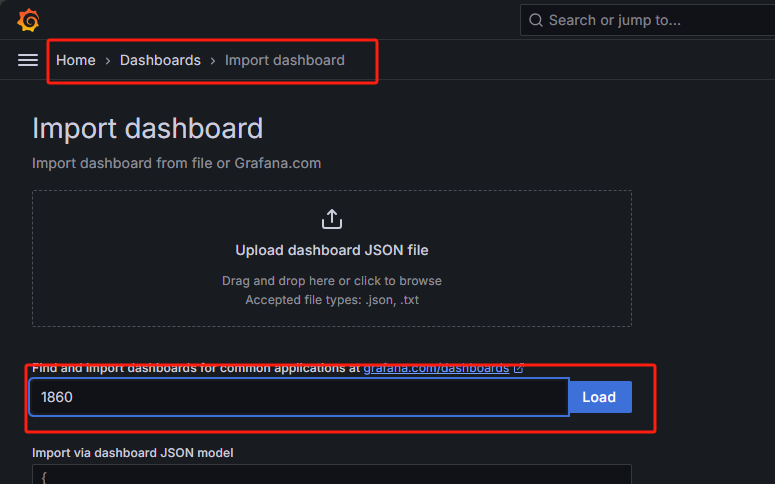
添加dashboard
这里使用1860id,节点监控仪表盘,更多仪表盘访问官方获取:Dashboards | Grafana Labs